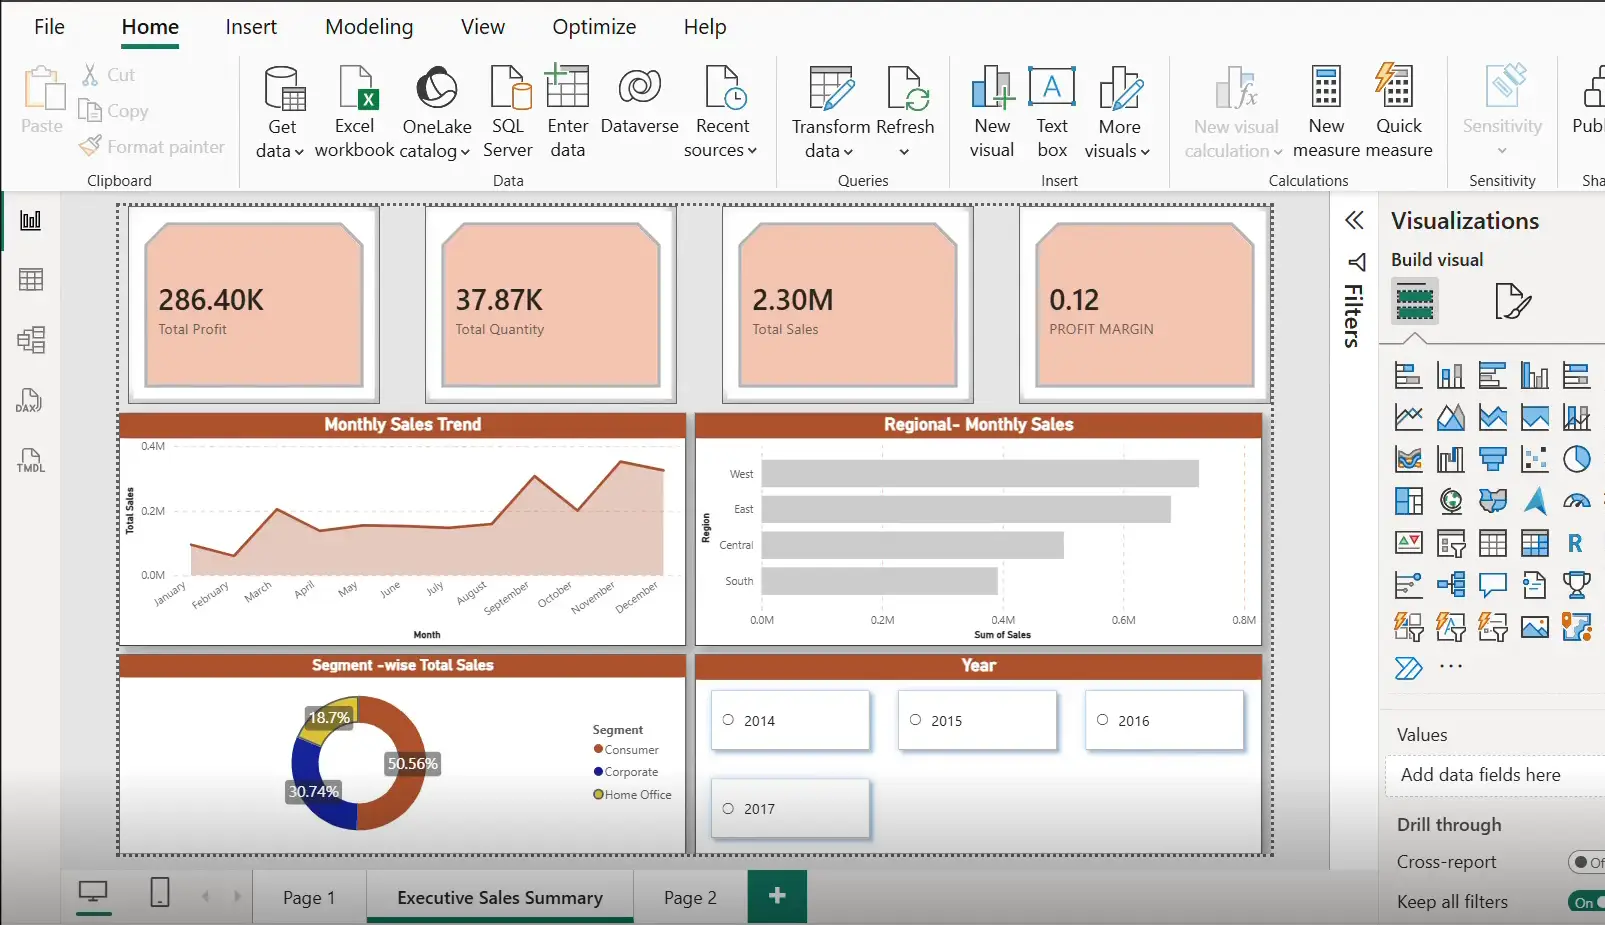
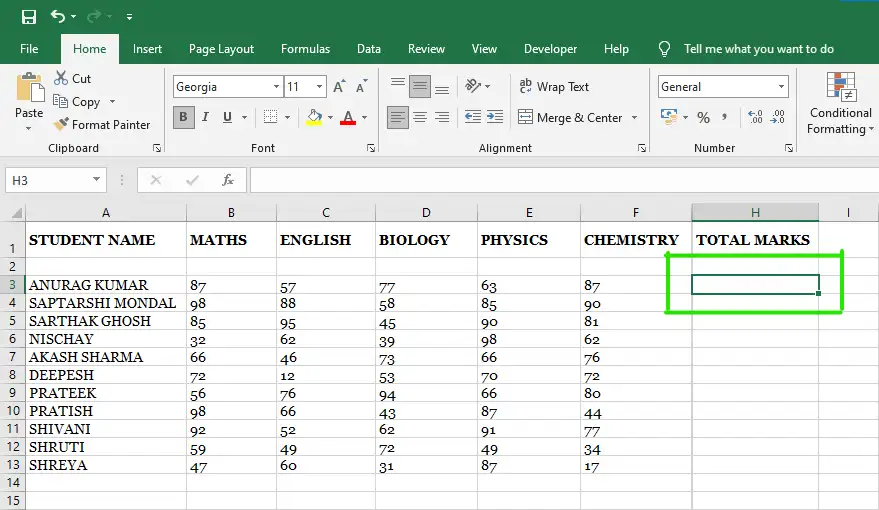
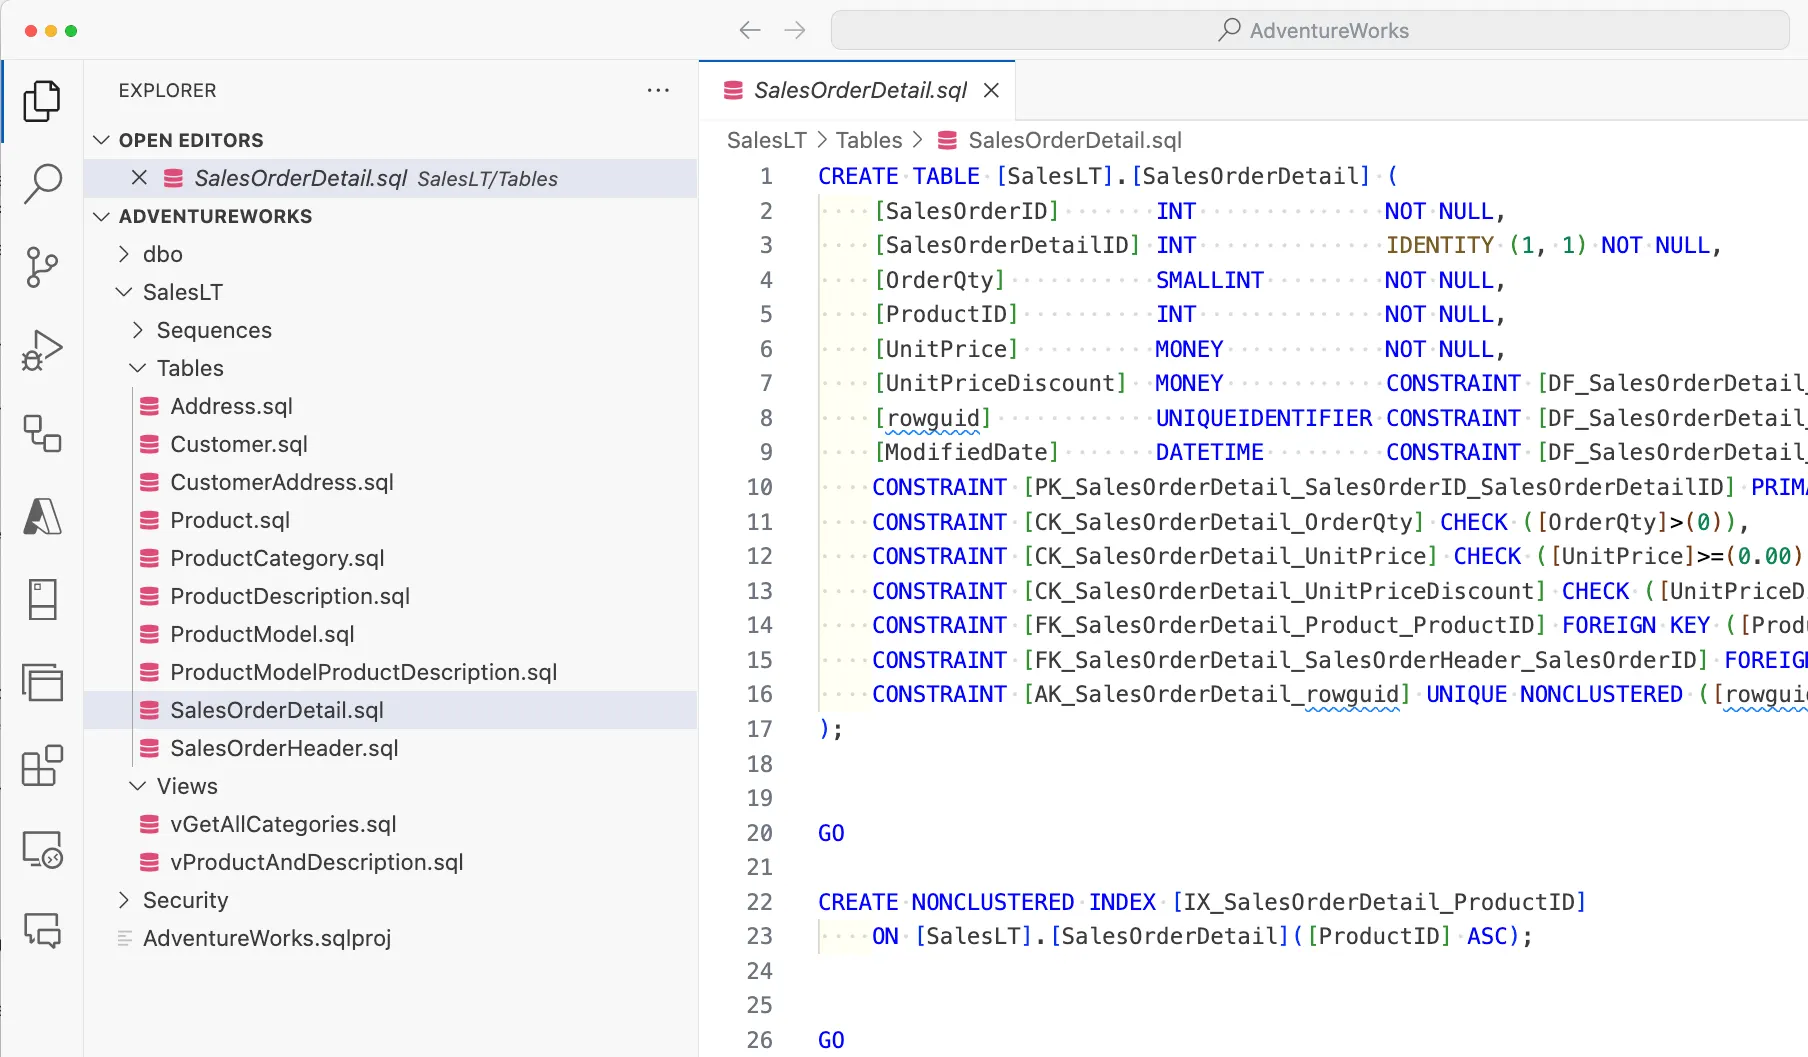
A 30-day program where you build a complete Business Intelligence workflow — from Excel and SQL analysis to an interactive Power BI dashboard that tells a real business story to stakeholders.
Every deliverable is portfolio-ready — the kind of work you walk into a Business Analyst or Data Analyst interview and immediately demo.
Advanced formulas (XLOOKUP, IF, INDEX-MATCH), pivot tables, and a polished Excel dashboard — the tool every business environment relies on daily.
A documented library of 10+ SQL queries answering real business questions — revenue by region, top customers, churn cohorts — using JOINs, GROUP BY, and CASE WHEN.
A relational data model across 3+ business tables — fact tables, dimension tables, and relationships — built using industry-standard star schema principles in Power BI.
Sales KPIs, YTD, MoM Growth, Customer LTV, and variance calculations built as reusable DAX measures — the core language of Power BI analytics.
A fully interactive dashboard with drill-throughs, slicers, time intelligence filters, and multi-page layout — covering sales, customer, and product performance.
A structured written report translating your findings into actionable business recommendations — presented to a simulated stakeholder panel on demo day.
Each week delivers a complete tool and skill layer — you don't move on until you've built something real.
Every skill below is something you'll have actually used in real business analytics projects.
Leave with proof of work across all six domains that companies actually hire for.
Understand the complete analytics lifecycle — from raw data extraction and cleaning to insight generation and business decision-making.
Clean, structure, and analyse business data using advanced Excel formulas, pivot tables, and dashboard-level reporting techniques.
Write efficient SQL queries to extract, join, and aggregate multi-table datasets — answering real business questions with data.
Build scalable data models using star schema principles in Power BI — the foundation for efficient and high-performance dashboards.
Create powerful DAX measures including YTD, MTD, and MoM calculations to build dynamic, interactive dashboards.
Translate data into actionable insights with clear storytelling, root-cause analysis, and stakeholder-ready business reports.
The skills from this program directly map to these high-demand roles — with real salary ranges.
Analytics lifecycle, KPI definition, SQL, and communicating insights effectively to business stakeholders.
End-to-end data workflows, SQL, Power BI visualisation, and building self-serve reporting systems.
Power BI dashboards, DAX, star schema modeling, and enterprise-level reporting infrastructure.
Metric definition, funnel analysis, user behaviour insights, and data-driven growth reporting.
Leave with proof of work across all six domains that companies actually hire for.

Build an interactive dashboard to analyze business performance across sales, revenue, and customer segments using real-world datasets.

Analyze and visualize data using Pivot Tables, dashboards, formulas, and scenario analysis to drive business decisions.

Work with structured databases to extract insights using complex queries, joins, aggregations, and performance analysis techniques.

Create professional BRDs, user stories, and acceptance criteria while simulating real stakeholder requirement gathering.
The demand for Business Analytics professionals is exploding. Hundreds of thousands of roles are waiting — are you qualified?